Introduction
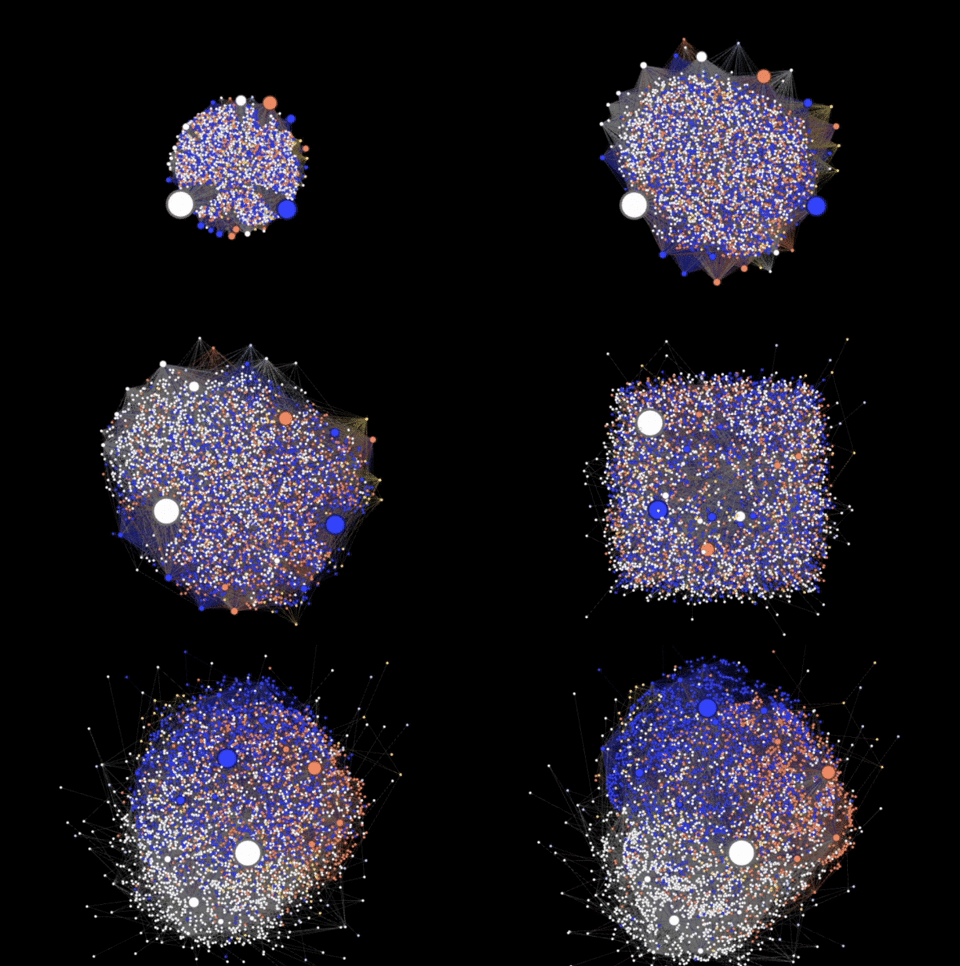
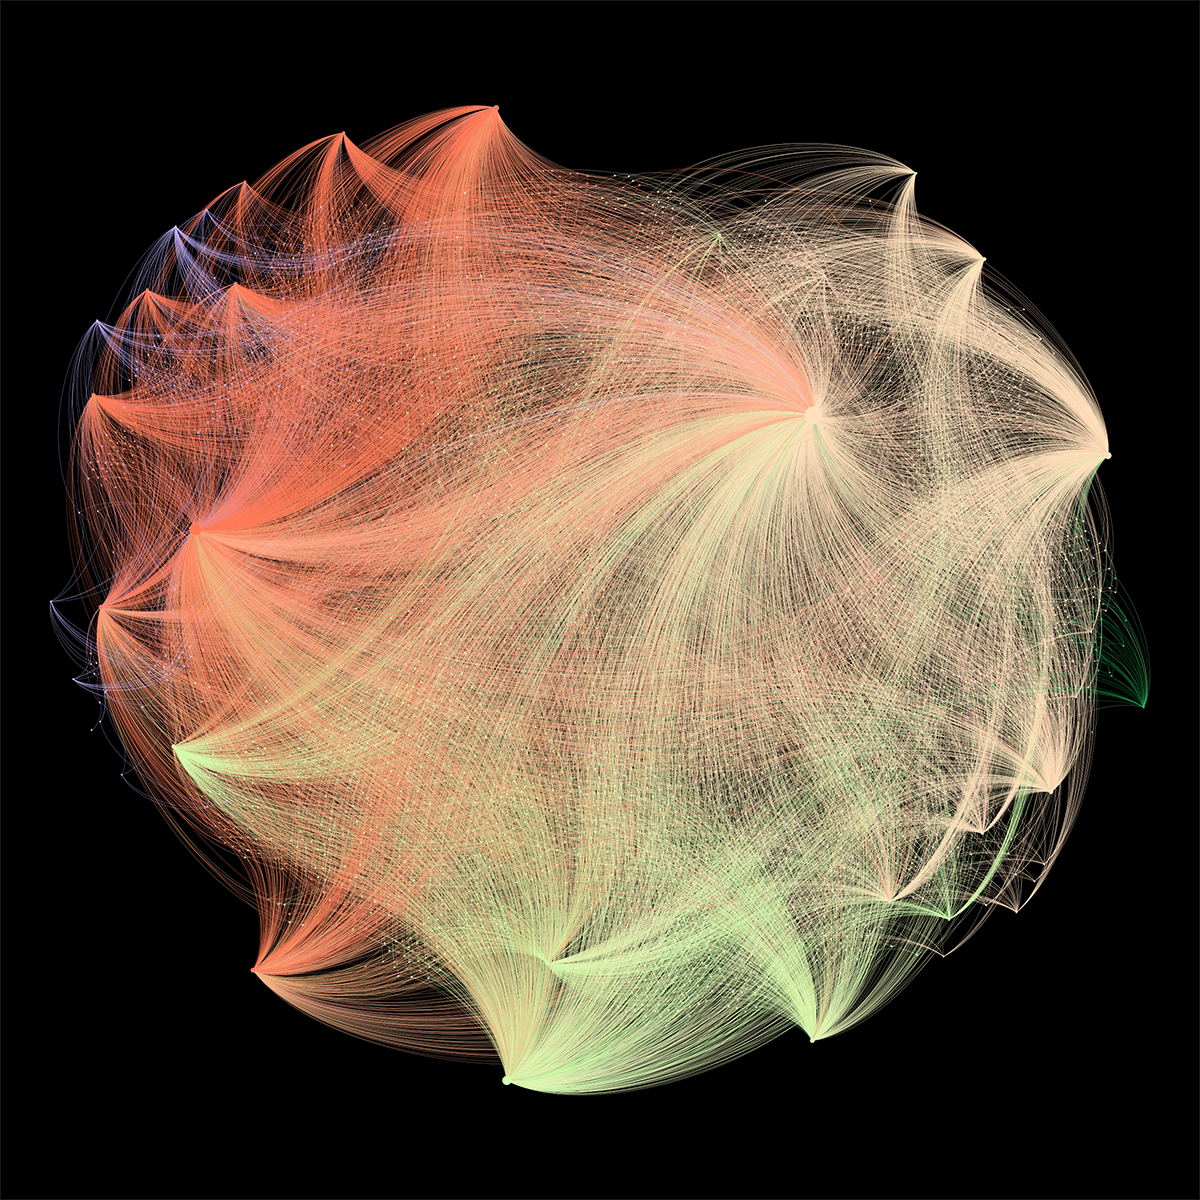
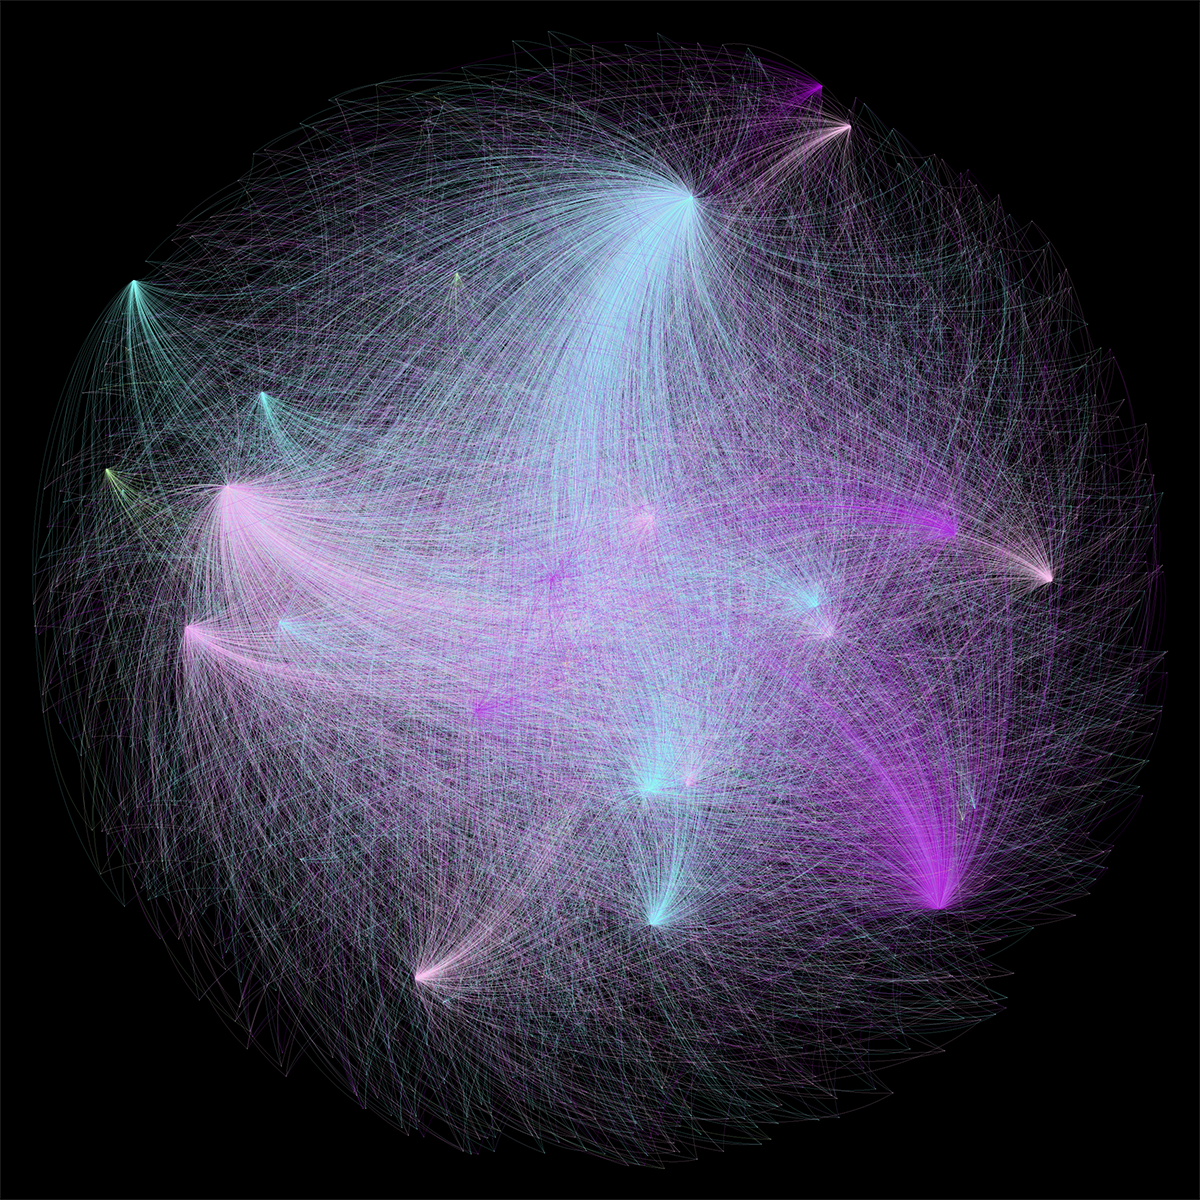
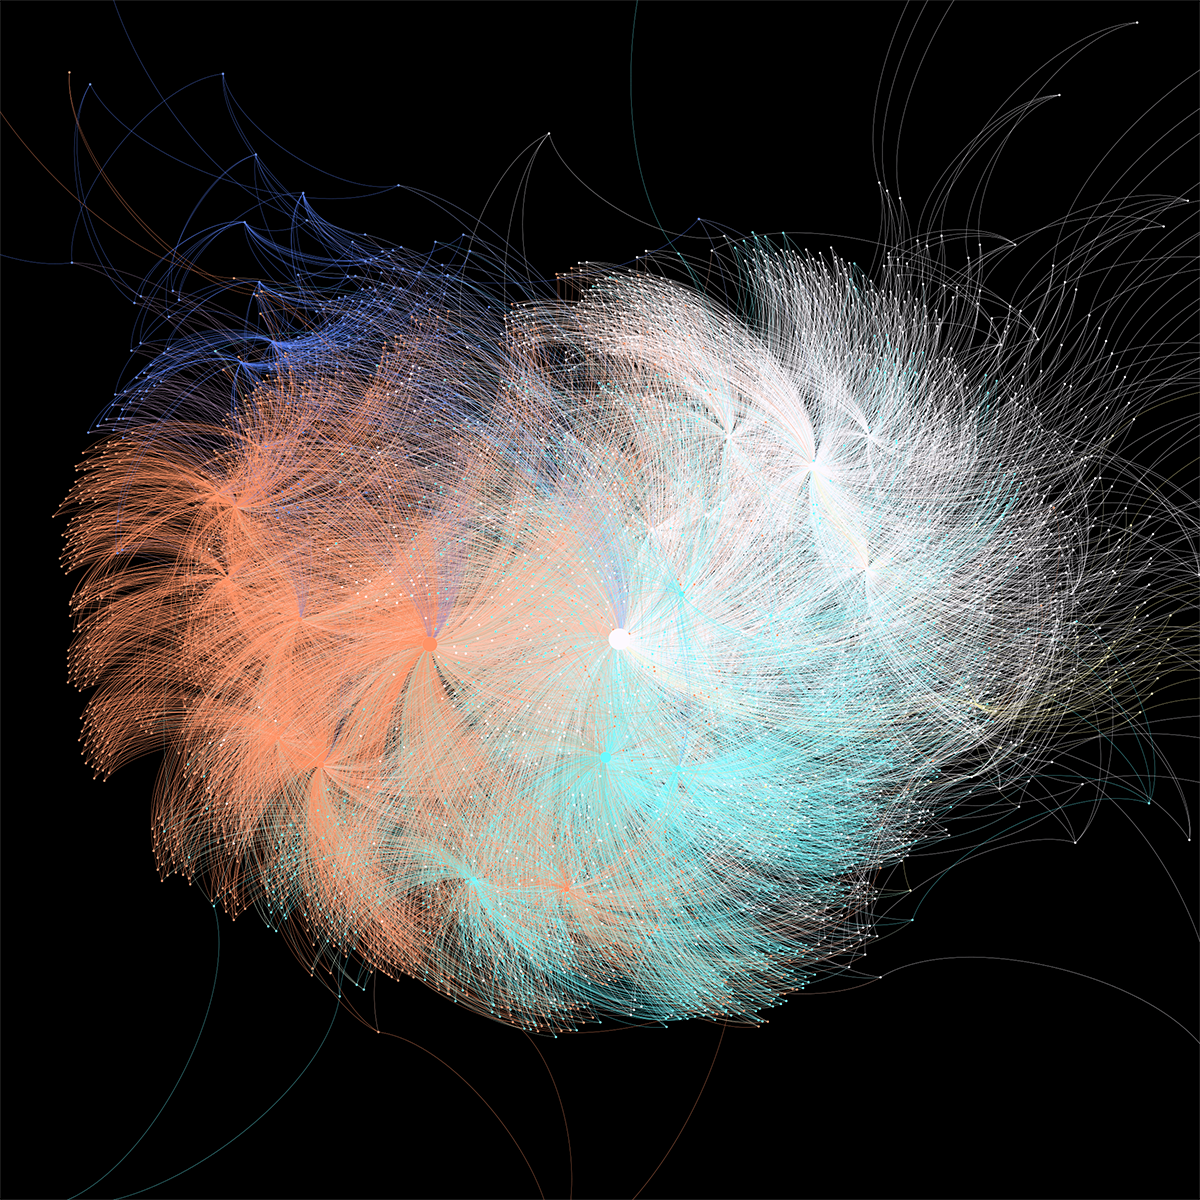
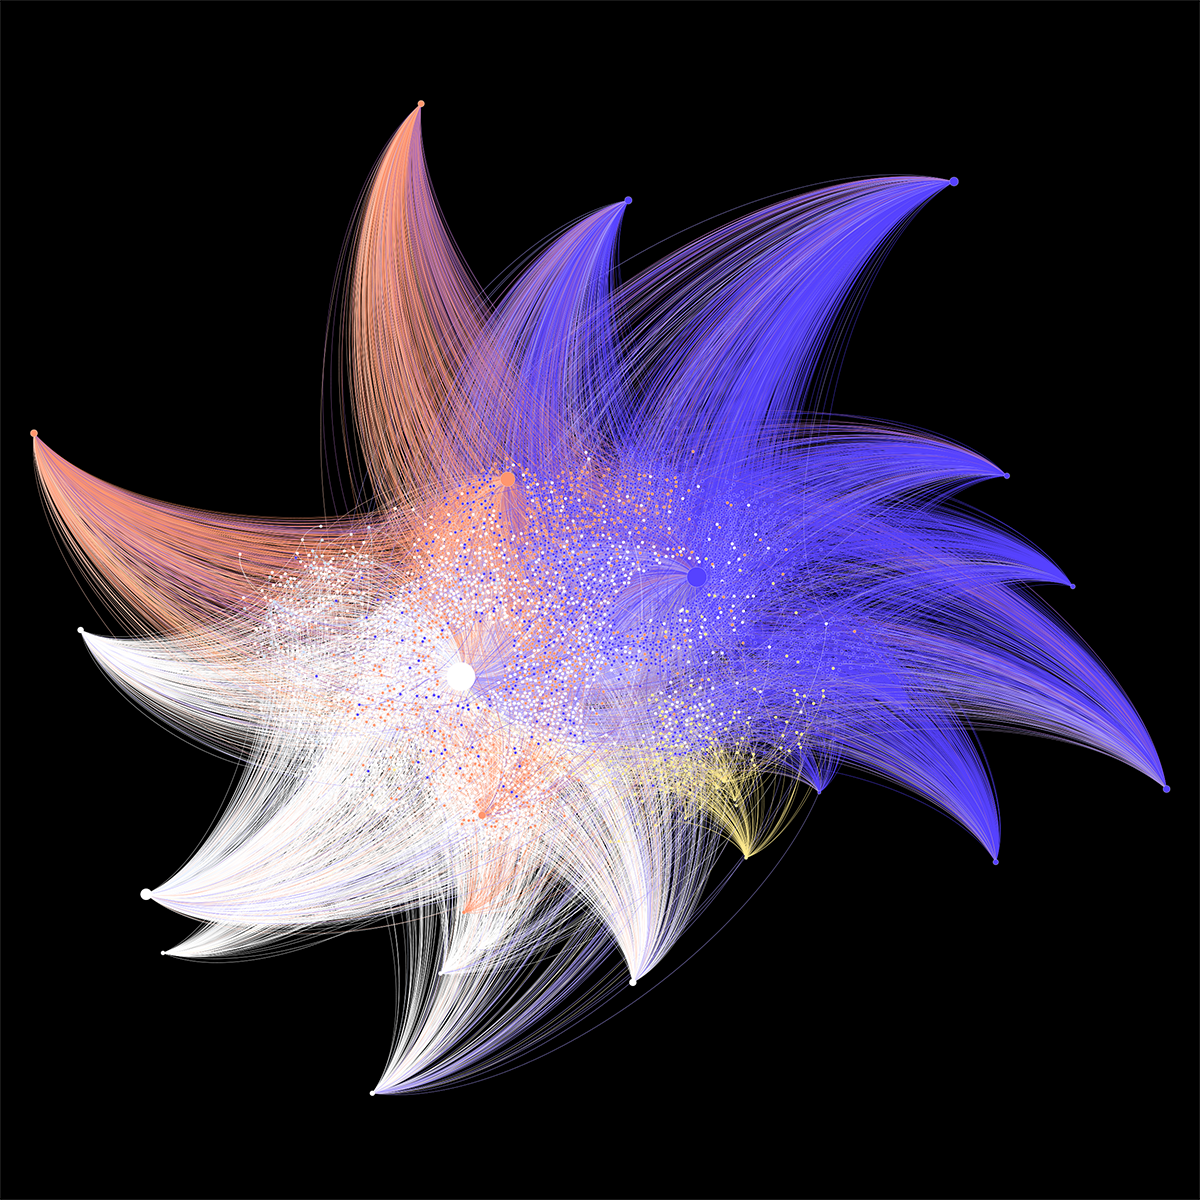
‘A Stranger to Words’ is an interactive network graph created by Meng Chih Chiang to visualize her personal learning experience in 2013. Based on her daily reading report, the personal database of 23,358 words were created originally to express the curve of how she understood words. The complicated graph evolves a great diversity of transformations, creating a mesmerizing interactive visual experience in which the language and the line of connection work in unison. Its goal is to introduce a new form of understanding language to reveals a connecting system of underlying text algorithm in novel and insightful ways and to unfold personal sentiments as a dyslexic through the capabilities of information visualization.
Interpretation
The graph consists of 4,525 nodes and 17,648 edges. Each word has four properties of English learning: 1. Known / Unknown, 2. Letter length, 3. Syllable length and 4. Frequency of occurrence. For example, the word “People” will connect to the node of “Known” (I knew the word), the node of “Occurrence 3” (It appeared 3 times totally), the node of “Length 8” (8 letters) and the node of “Syllable 2”. The size of a node in the graph is determined by the number of nodes/words to which it is connected, with bigger circle indicating more connections.
Node = words I read or word’s properties
Edge = A word’s connection to its properties
Node size = Degree = number of connections
Node Color = Modularity = the group to which each word belong
Interaction
1. Zoom in to enlarge the network to see words clearly
2. Roll over any node of word, it will show 4 line of their properties.
3. Roll over the node of property, it will show all the words which own this trait.
Tools
The data was processed by Excel programming at first, generating particular ID and assigned serial number. Then the layout of the huge data set was preprocessed using the Gephi visualization platform and rendered with the JavaScript library sigma.js.


